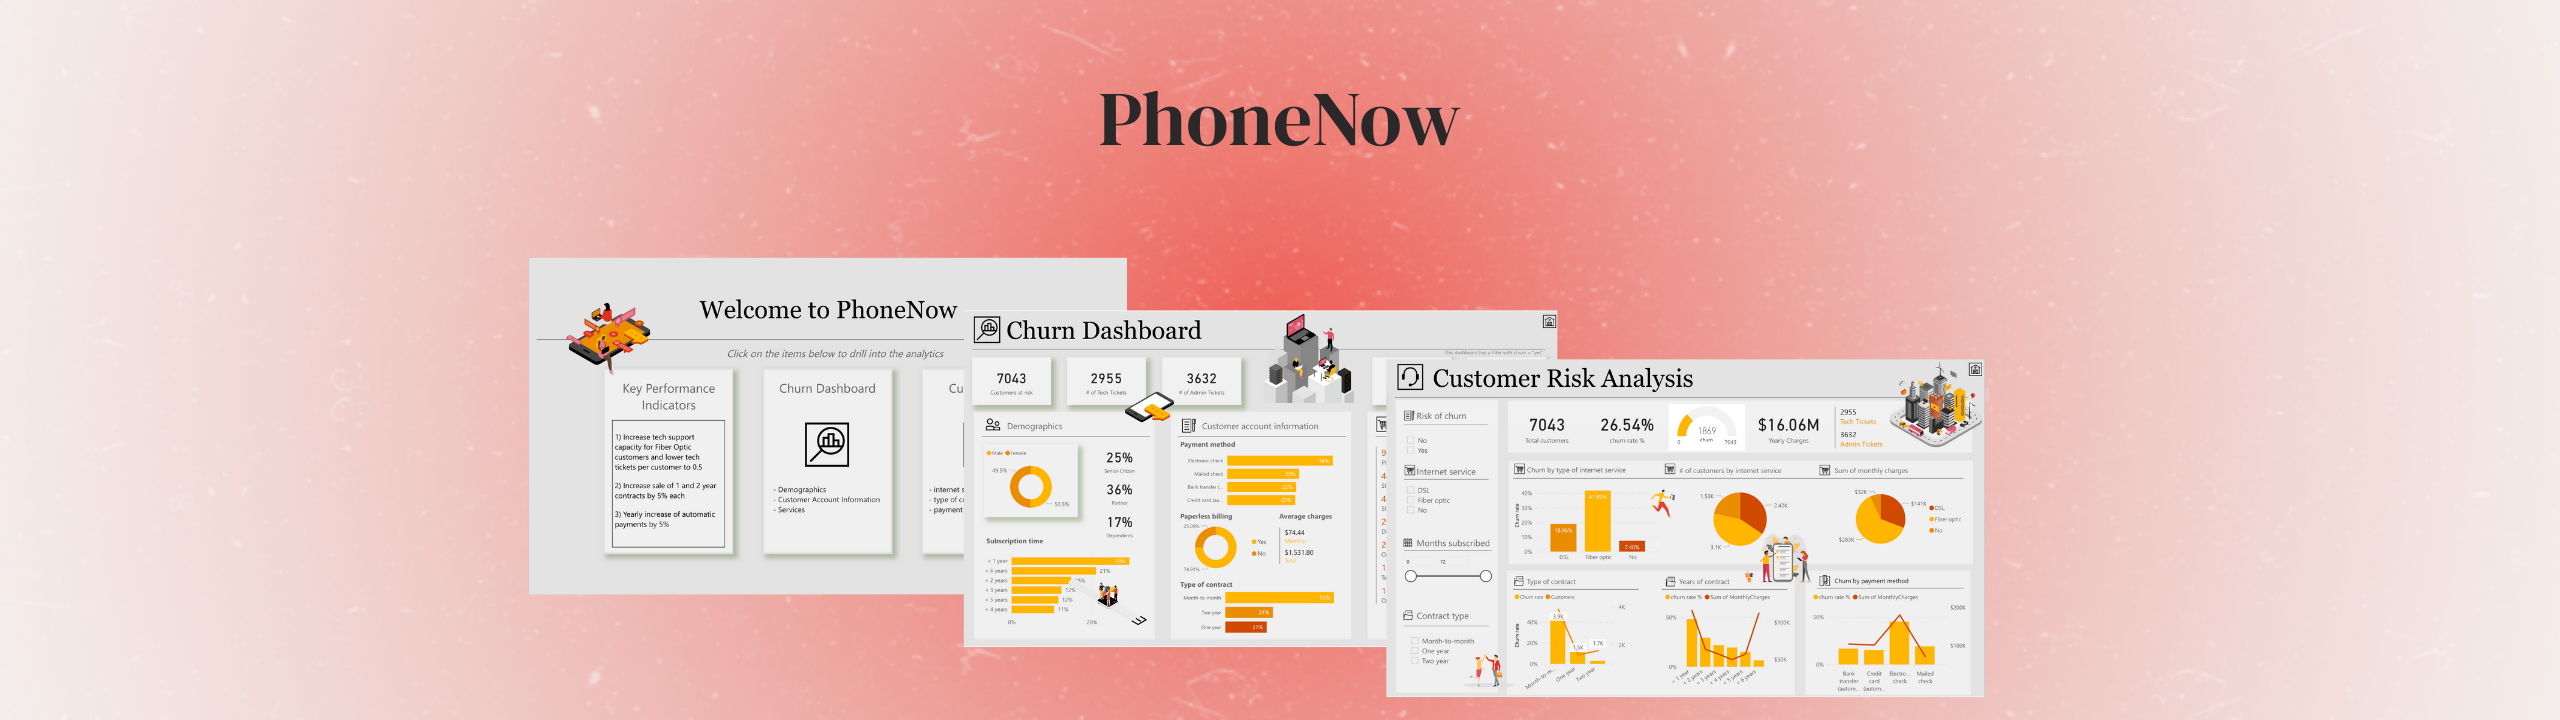
Analyzing Customer Churn Patterns and Risk Factors with Power BI
A multi-section dashboard that connects churn drivers to actionable retention insights.
Overview
This project is an interactive Power BI dashboard designed for PhoneNow, a telecom company, to analyze customer churn behavior and identify key risk factors. The dashboard supports business decision-making by combining high-level KPIs with detailed churn and risk analysis views. The solution is structured into three main sections: Key Performance Indicators, Churn Analysis, and Customer Risk Analysis.
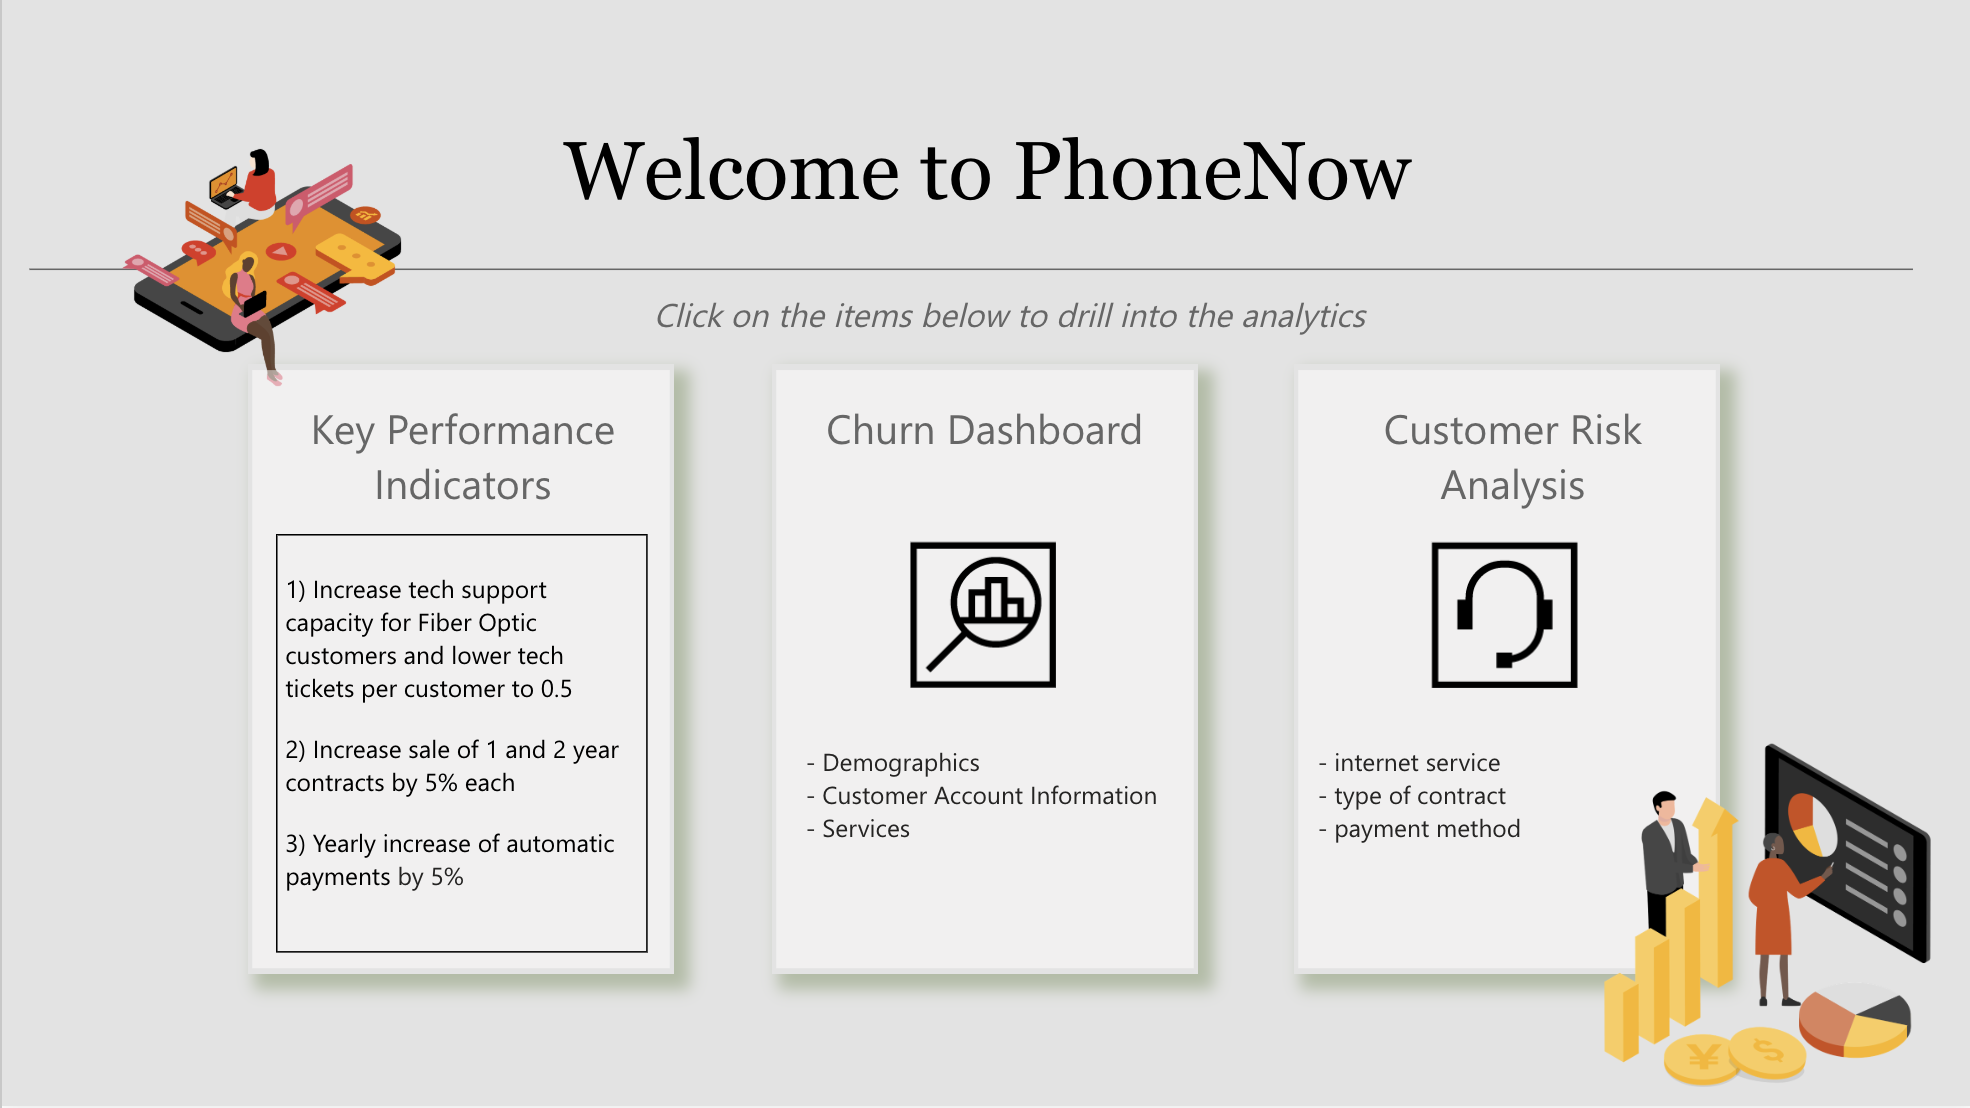
Key Performance Indicators
It provides an overview of business performance and retention-related goals, such as contract growth and support efficiency. These metrics offer quick context before deeper analysis.
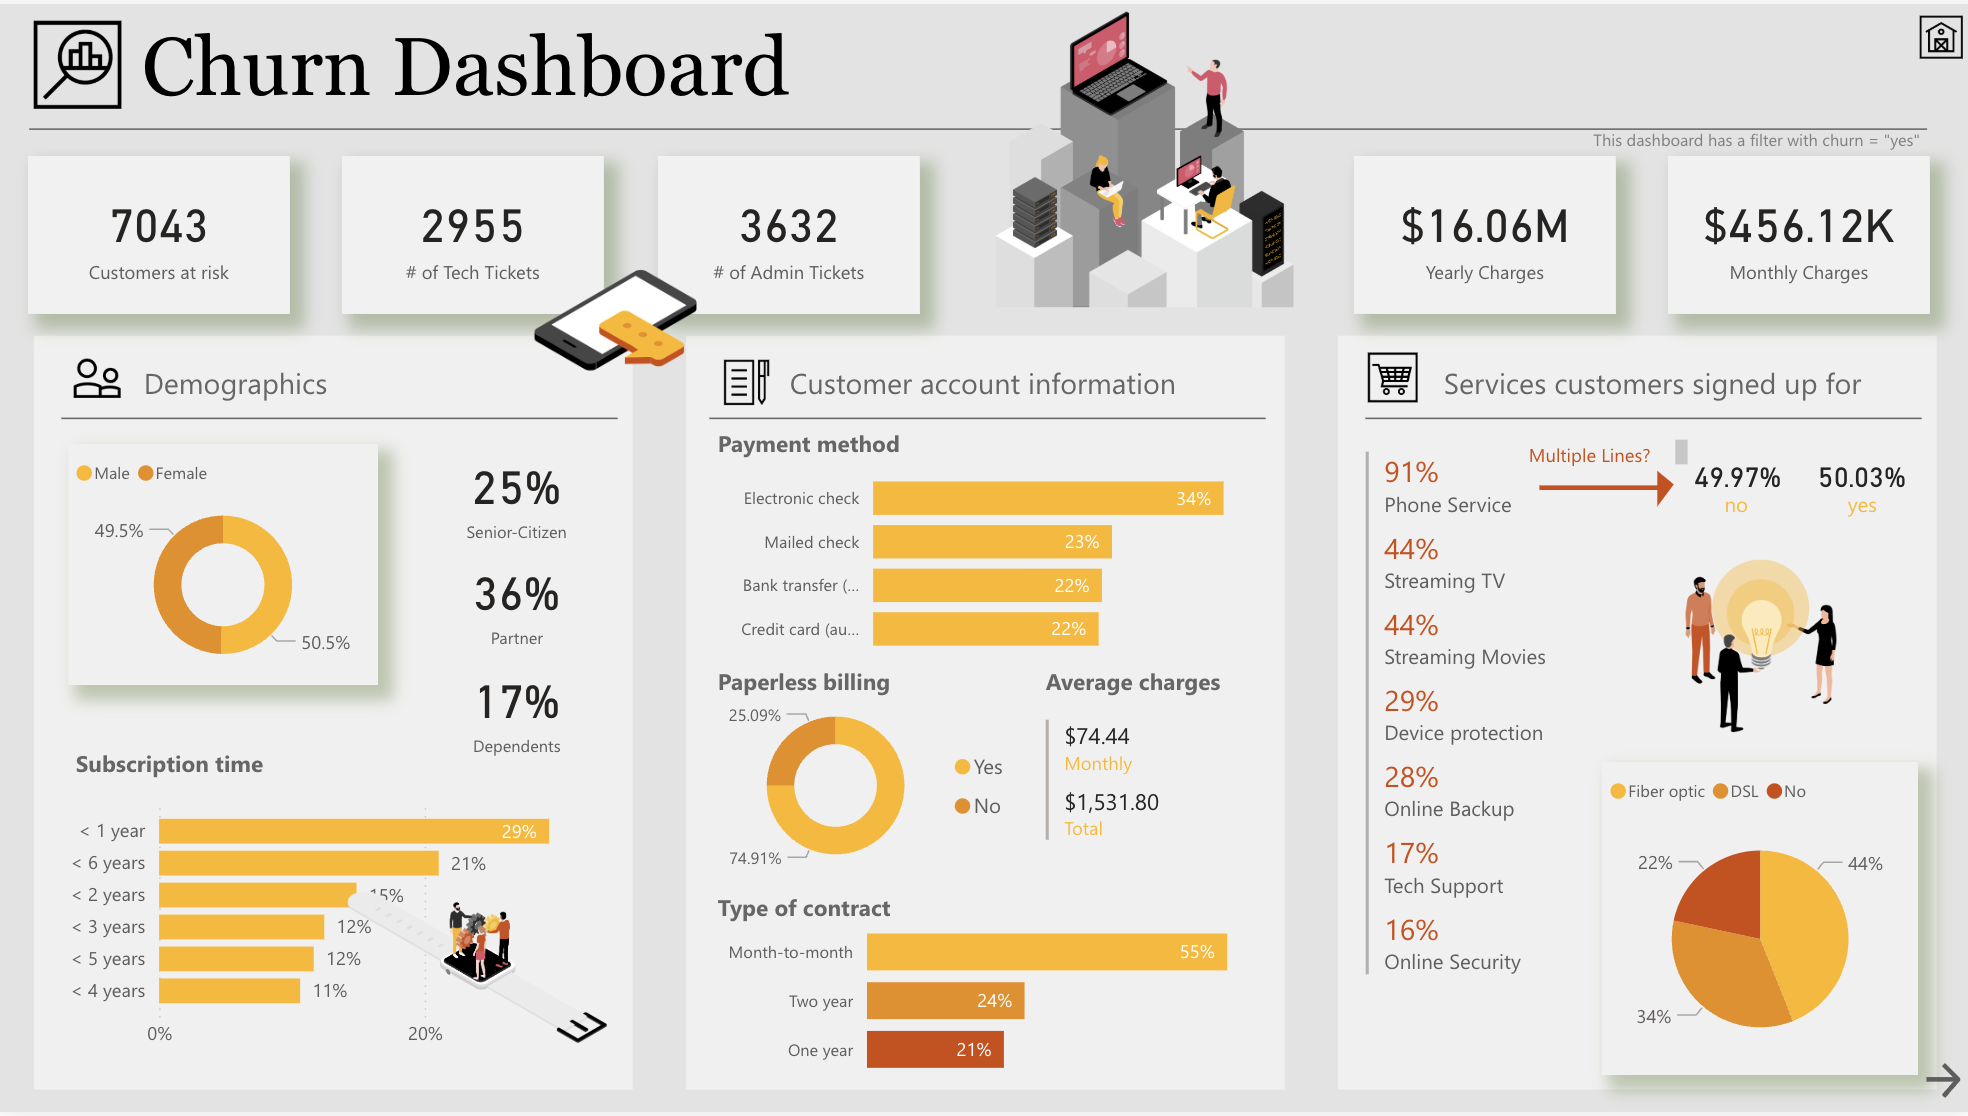
Churn Analysis
This section explores churn patterns across customer demographics, subscription length, contract type, payment method, and service usage. Visual breakdowns highlight differences between churned and retained customers, making trends easy to compare.
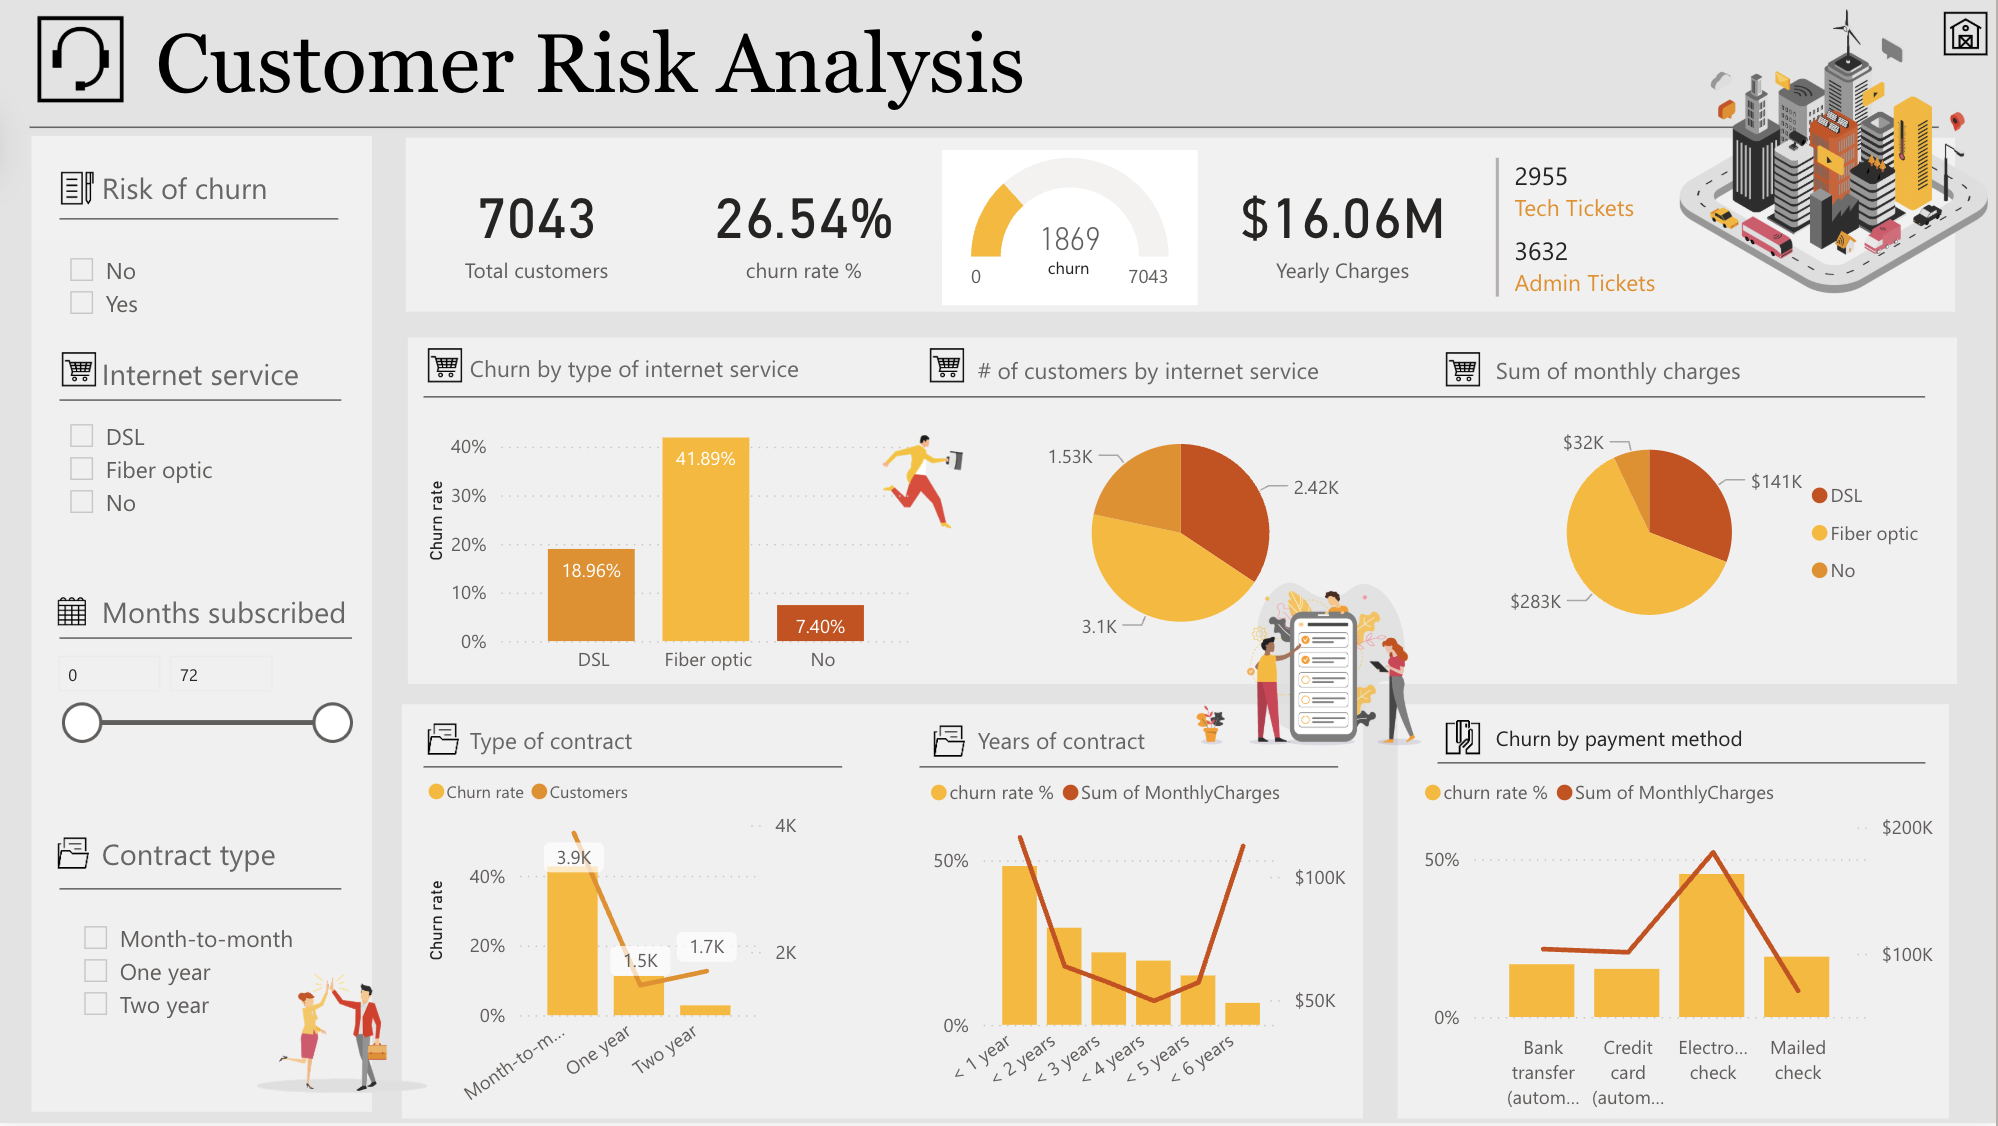
Customer Risk Analysis
The risk analysis view focuses on identifying high-risk customer segments through cross-analysis of internet service types, contract duration, multiple service subscriptions, and billing behavior. This helps surface patterns that contribute to higher churn rates.
Key Features
Clearly defined business KPIs aligned with retention and contract strategies. Interactive slicers for service type, contract duration, and churn status. Comparative visualizations showing churn differences across customer segments. Aggregated insights supporting targeted retention actions, such as focusing on high-risk fiber optic users or reducing reliance on month-to-month contract.
Other Projects

Performance Analytics
Visualizing call center metrics through Power BI.

Workforce Analytics
Visualizing hiring, promotion, and representation trends.